Code Example#
Let \(y = f(x)\), where \(x \in [0, 5\pi]\). Consider the following three functions:
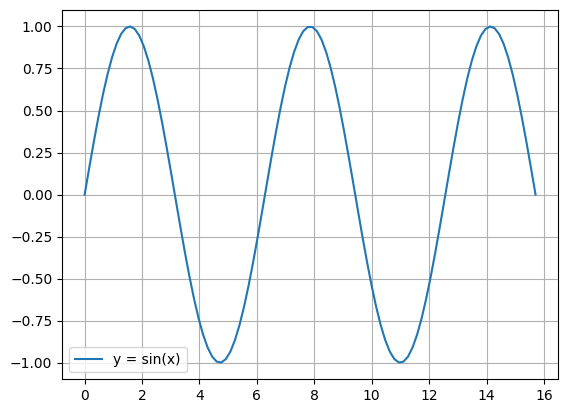
(a) \(f(x) = \sin(x)\)
(b) \(f(x) = \sin(2x)\)
(c) \(f(x) = 2\sin(x)\)
Plot these function to better understand how frequency and amplitude affect the shape of the sine wave.
# Import necessary libraries
import numpy as np
import matplotlib.pyplot as plt
x = np.linspace(0, 5*np.pi, 100)


y = np.sin(x)
plt.plot(x, y, label='y = sin(x)')


plt.legend() # Add a legend to the plot
plt.grid(True) # Add a grid to the plot
plt.show() # Display the plot